Abstract
This blog post presents the architecture and core design principles behind a secure IoT gateway written in Rust. The system connects STM32-based edge devices with cloud analytics via MQTT, SQLite WAL persistence, OpenTelemetry tracing, and Prometheus metrics. It demonstrates how to build reliability, observability, and security in from day one— with practical insights drawn from real-world projects.
Introduction
Building IoT systems that can scale securely and operate reliably in production is one of the hardest technical challenges. I have seen organizations lose critical telemetry, experience data gaps, or struggle with software updates because reliability and observability were treated as afterthoughts.
As part of my consulting work at Combotto.io, I set out to build a Rust-based IoT gateway that demonstrates how to connect STM32 edge devices to cloud infrastructure with built-in reliability, observability, and security— the same architectural principles I apply when auditing and hardening production IoT infrastructures for clients.
This article walks through the system design from edge to cloud and presents concrete implementation strategies, architecture viewpoints, and lessons learned from real deployment scenarios.
Background – Design Philosophy
Inspired by the architectural perspectives of Rozanski and Woods [1]— such as security, performance & scalability, availability, and robustness— I apply the same mindset when designing IoT gateways. To achieve production-grade quality and meet customer expectations, I focus on three guiding perspectives:
- Reliability: Every message must survive network failures (WAL + retry logic).
- Observability: Traces and metrics must clearly show what the system is doing.
- Security: From device authentication to encrypted telemetry and system hardening.
These perspectives shape how I structure IoT systems end-to-end— from embedded devices in the field, through the gateway layer, to analytics and monitoring systems in the cloud.
Architecture Overview — From Edge to Cloud
This section describes the architecture of the Rust IoT gateway (edge-to-cloud), covering context & scope as well as the functional elements, their responsibilities, and interfaces.
Context & Scope
To understand the gateway’s context and boundaries, a Context Viewpoint diagram is used to show system relationships and interactions with external actors when designing for reliability, observability, and security. The diagram illustrates an edge-to-cloud setup where an STM32 sensor communicates with an edge MQTT broker. The edge broker communicates with the Rust gateway via an MQTT client that subscribes to the topics published by the STM32 sensor. The MQTT client persists data to a write-ahead log (WAL queue) and then forwards it to the cloud layer.

The gateway is written in Rust and runs as a single containerized instance on an edge host (x86/ARM). It includes device ingest, durable buffering, processing, cloud publishing, and observability.
External services / actors
The system interacts with several external actors and services:
- Devices (STM32 sensors): publish telemetry via MQTT and receive control messages.
- Cloud backend services:
- Analytics Service (HTTP/gRPC ingest)
- S3 (object storage for archiving)
- Prometheus (metrics scraping)
- Tempo / OTLP Collector (trace ingestion)
- Grafana (metrics and trace visualization)
- Operator / Admin: interacts via Admin API and logs.
The internal details of these external systems are out of scope.
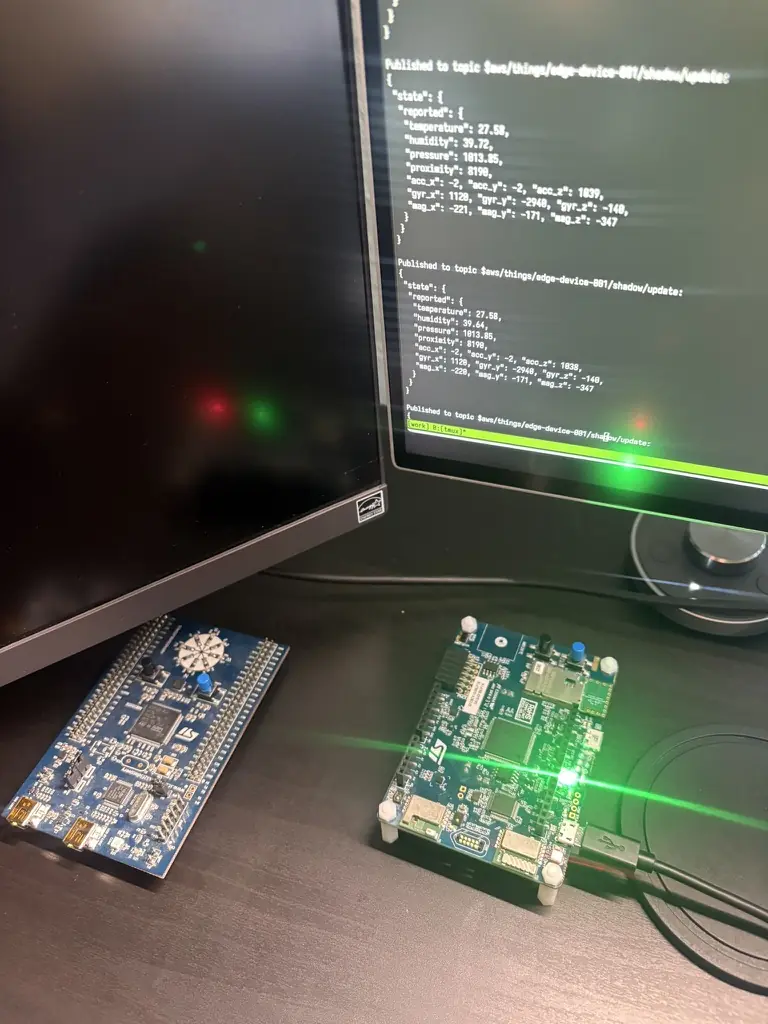
Demo video — gateway walkthrough (edge-to-cloud data flow)
The video below demonstrates how the architecture works in practice, including a full walkthrough of the edge-to-cloud data flow using physical STM32 devices. Network disruptions are intentionally introduced to show how the gateway absorbs failures, buffers telemetry reliably, and resumes delivery without data loss.
Functional Elements & Responsibilities
The functional elements consist of deployable Rust services/crates bundled into a single containerized gateway binary, organized as modules. A Functional Viewpoint diagram was created to visually describe the functional elements, their interfaces, and responsibilities.

Below is a list of the functional elements of the Rust IoT gateway — Ingest Plane.
MQTT Telemetry Client
Maintains a robust MQTT session to ingest telemetry from devices and handle control messages.
- Connects to an edge MQTT broker (local or embedded) with a configured Client ID and credentials; maintains session and keep-alive.
- Subscribes to telemetry and control topics (I1A & I6).
- Parses payloads (JSON/Protobuf), validates format, and forwards them to the Ingest Router.
- Applies QoS=1 semantics with automatic reconnect and exponential backoff.
Ingest Router
Normalizes incoming telemetry and enriches it with gateway metadata before durable persistence.
- Validates/normalizes payload (schema version, size, required fields).
- Enriches with
gateway_id,receive_ts,correlation_id. - Produces a canonical record and appends it to the WAL queue.
HTTP Server
Provides a simple ingest path for devices/services that cannot speak MQTT.
POST /ingest/{device_id}accepts JSON payload; authenticates/authorizes the request (I1b).- Reuses the same validation and enrichment flow as MQTT (Ingest Router).
- Appends records to the WAL and returns success with a correlation id.
Config & Secrets
The gateway uses a layered configuration system where defaults can be overridden by files, environment variables, and CLI flags. This enables secure secret handling and flexible configuration across environments.
- Loads config via env/files → strongly typed config.
- Manages certificates/keys (I4).
Admin & Health API
Provides operational insight and control through a lightweight HTTP interface.
- Exposes endpoints for liveness
/healthz, readiness/readyz, metrics/metrics, and version/version(I2). - Integrates with Prometheus and monitoring tools for automated scrapes and alerts.
- Enables operators and CI/CD pipelines to verify state before deployment or restart.
Control Plane
Enables control of devices and MQTT at the edge layer through reliable routing and policies.
- Handles incoming commands via MQTT topics (configuration updates, tests, etc.).
- Persists/applies configuration and publishes control messages to devices.
Telemetry (Observability)
Telemetry collects the system’s output signals — logs, traces, and metrics — used for observability: understanding internal system state via its emitted data. The gateway uses OpenTelemetry for tracing, Prometheus for metrics, and structured JSON logging for additional insight.
- Tracing: spans for ingest, WAL append, publish, retry; exported via OTLP to Tempo/collector.
- Metrics: Prometheus
/metricsendpoint (ingest rate, queue depth, publish success %, latency, CPU/memory IO). - Logging: structured JSON logs.
WAL Queue (Durable Buffer)
Reliability is built on the principle that every message must survive network failures. To guarantee at-least-once delivery, an append-only SQLite write-ahead log (WAL) is used. This enables crash-safe recovery and idempotent retries — ideal in edge environments.
- Append-only WAL for at-least-once delivery.
- Status: Enqueued → InFlight → Acked/Dead.
- Compaction & retention.
- Backpressure thresholds.
- Crash-safe recovery.
- Idempotency keys.
Dispatcher
Coordinates delivery by fetching batches from the WAL queue and managing flow automatically and reliably.
run_dispatcher: fetch N, mark InFlight.- Runs
publish(); schedules retries. - Acks the WAL on success.
Fanout
A FanoutSink<T> enables broadcasting to multiple downstream sinks.
This provides failure isolation per sink and enables delivery to e.g. S3, MQTT, or Kafka in parallel.
- Broadcast to multiple sinks.
- Per-sink failure isolation.
- Supports: S3, MQTT, Kafka.
Recovery Tools
Dashboards and tools to help operators with incident handling.
- Requeue or export dead-lettered messages; supports replay.
- Diagnostics for failed publishes and WAL inconsistencies.
Interfaces
Below is a list of interfaces for the Rust IoT gateway — Ingest Plane.
I1a. MQTT Telemetry Ingest
- Protocol: MQTT
- Topics: Subscribes:
devices/{device_id}/telemetry - QoS: 1 (at-least-once). Retain = false.
- Payload: JSON/Protobuf (configurable)
- Errors: invalid schema
I1b. HTTP JSON Ingest
- Protocol: HTTP
- Endpoint: POST
/ingest/{device_id} - Payload: JSON
- Errors: invalid schema
I2. Admin HTTP API
GET /healthz→ 200/500GET /readyzGET /metricsGET /version
I3. Observability Export
- Tracing: OTLP/HTTP → Tempo
- Metrics: Prometheus scrape
- Logs: stdout
I4. Config & Secrets
- Inputs: env vars
- Contract: typed schema with defaults.
I5. Local Persistence (Local WAL)
- DB: SQLite WAL
- Durability: fsync + checkpoint.
I6. Control Topics
- Device commands via MQTT
Deployment Viewpoint — Rust IoT Gateway (Edge → Cloud)
Designing IoT systems that operate reliably in the field requires more than a functional design. The Deployment Viewpoint describes where each element runs, how components communicate, what infrastructure is required, and how security, reliability, and observability are enforced in production.
This section explains the operational environment for the Rust IoT gateway — from STM32 devices in the field, to the MQTT broker and gateway container on the edge host, and onward to cloud-based observability and analytics services.
Runtime Platform & Deployment Topology
At each site, STM32 devices publish telemetry over MQTT to an edge MQTT broker running on a Docker host. A Rust gateway container consumes the messages, persists them to a local SQLite WAL, and forwards them securely over TLS to cloud analytics and observability services (Prometheus, Grafana, Tempo, Analytics, S3).
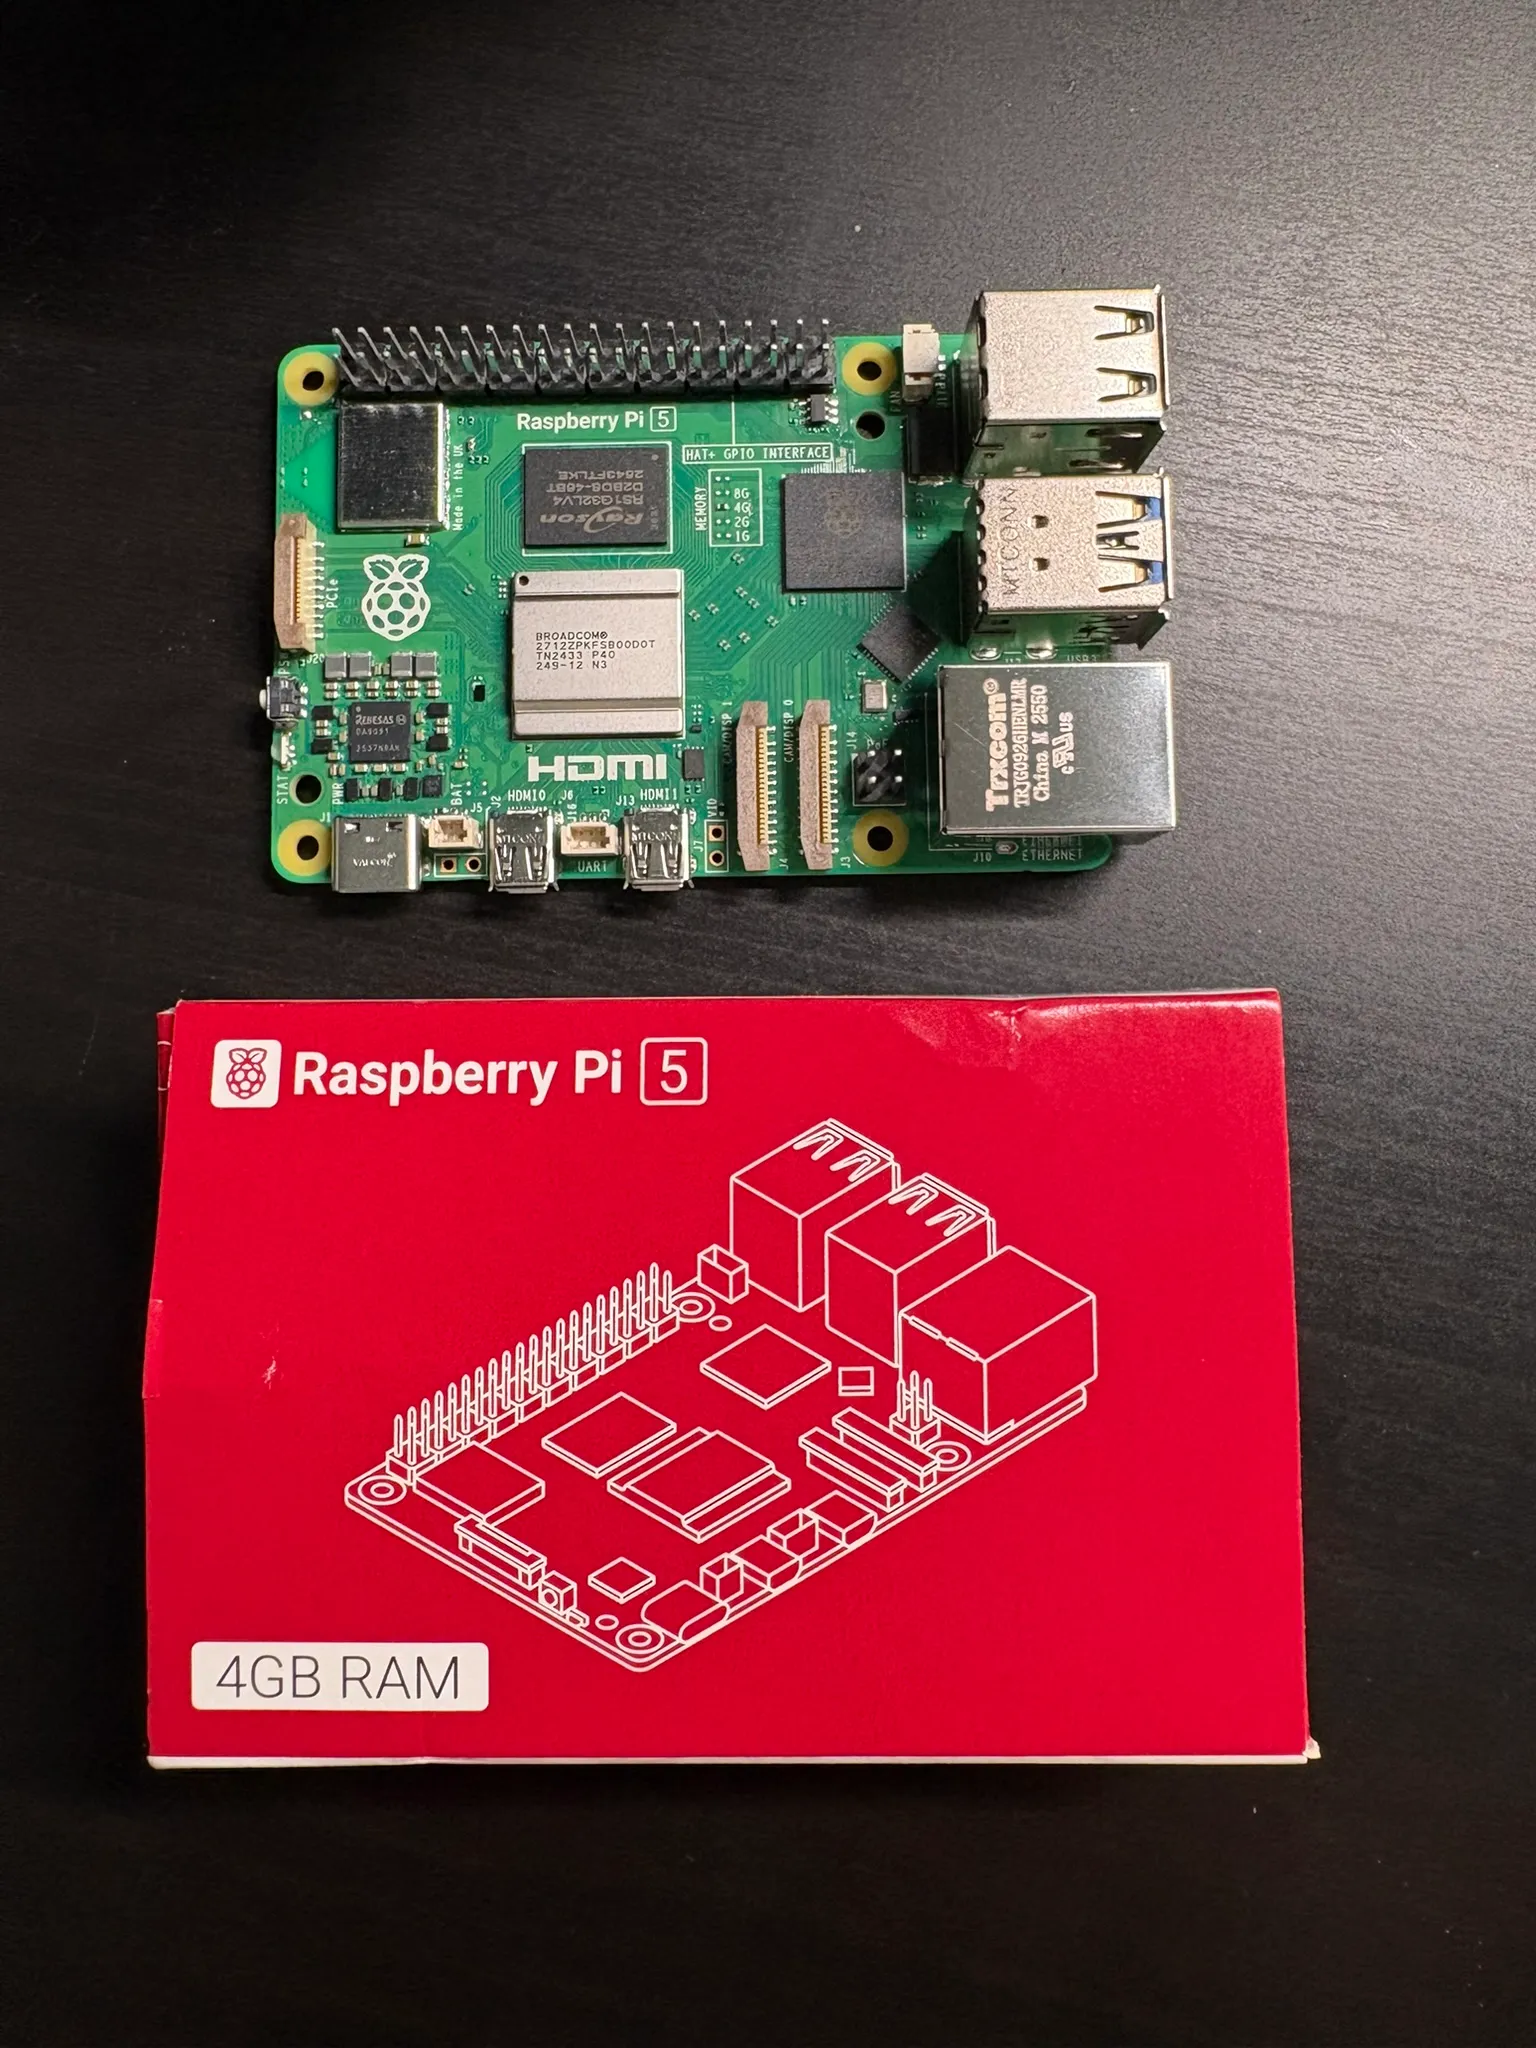
In the current reference deployment, that edge host is a Raspberry Pi 5 (4 GB RAM). It is powerful enough to run the gateway container, local WAL storage, and the broker side-by-side, while still staying small enough for on-site edge installations.
The table below shows the runtime components, their containers, storage, ports, and notes — mapped from the functional elements.
| Component | Container | Storage | Ports | Notes |
|---|---|---|---|---|
| STM32 devices (B-L475E-IOT01A1) | Bare-metal firmware (no container) | On-board flash (firmware + config) | MQTT over TLS via Wi-Fi (client only) | Publishes signed telemetry to the edge MQTT broker using mTLS client certificates. |
| Edge MQTT Broker | eclipse-mosquitto:2 | /mosquitto (config, certs) | 8883/tcp | mTLS; topic ACLs for devices and gateway. |
| Rust Gateway container | combotto/gateway:TAG | /data (SQLite WAL) | 8080/tcp | /metrics, /healthz, /readyz, /version; MQTT + HTTP ingest |
| Prometheus | Managed service or prom/prometheus (Docker) | Local disk / managed storage | 443/tcp or 9090/tcp | Scrapes the gateway’s /metrics and stores time series. |
| Grafana | Managed service or grafana/grafana (Docker) | Local disk / managed storage | 443/tcp or 3000/tcp | Dashboards for Prometheus metrics and Tempo traces. |
| Tempo | Managed service or grafana/tempo (Docker) | Object storage (S3/MinIO) or local disk | 443/tcp or 3200/tcp | Distributed trace storage; accessed through Grafana. |
| OTLP Collector | Managed service or otel/opentelemetry-collector (Docker) | Stateless | 4317/4318/tcp, 443/tcp | Receives OTLP telemetry, batches it, and forwards to Tempo. |
| Analytics API | Backend service (Kubernetes / VM / Docker) | Application DB / data lake | 443/tcp | Receives telemetry from the gateway over HTTPS (idempotent ingest). |
| S3 / Object Storage | Managed S3-compatible storage | Bucket per environment | 443/tcp | Optional offload/archiving of telemetry. |
Runtime Platform Model Diagram
The runtime platform model describes the concrete hardware and execution environments hosting the gateway’s functional elements. The model is organized into edge, gateway host, and cloud nodes.
Edge Site Nodes
| Processing node | Execution environment | Deployed artifacts | Notes / sizing |
|---|---|---|---|
| STM32 devices (B-L475E-IOT01A1) | STM32L475VG MCU, Arm Cortex-M4 @ 80 MHz, 128 KB SRAM, 1 MB Flash. Bare-metal or RTOS-based firmware. Onboard sensors: IMU, magnetometer, barometer, humidity/temperature, ToF, microphones, etc. | Firmware that samples sensor data, publishes MQTT over TLS, and listens to control topics. | Limited RAM/Flash implies minimal local buffering and constrained protocol stacks. Reliability is primarily handled by the MQTT broker + Rust Gateway WAL. |
| Edge MQTT Host (Raspberry Pi 5 or industrial PC) | Linux (Ubuntu 24.04), ARMv8 or x86-64, 2 vCPU, 4 GB RAM, Docker ≥ 24. | eclipse-mosquitto:2 container, TLS certificates and ACLs. | Typically co-located with the gateway; the Raspberry Pi 5 reference setup keeps the field footprint compact while retaining stable Wi-Fi connectivity for STM32 boards. |
Choosing the B-L475E-IOT01A1 (80 MHz, 128 KB RAM) strongly impacts gateway design: the device cannot maintain deep queues or heavy protocol stacks, so durability and retry mechanisms are shifted to the edge broker + Rust Gateway WAL — a typical pattern for constrained IoT.
Gateway Host Node
| Processing node | Execution environment | Deployed artifacts | Notes / sizing |
|---|---|---|---|
| Rust Gateway Host | Raspberry Pi 5 (4 GB RAM) or a separate industrial PC, 4 vCPU, 4-8 GB RAM, SSD ≥ 50 GB | combotto/gateway:TAG container, config, SQLite WAL under /data | Hosts the ingest plane: MQTT, HTTP ingest, WAL, Dispatcher, Fanout, Admin API, and telemetry. The Raspberry Pi 5 deployment is the current reference setup; WAL sizing depends on ingest rate and expected outage window. |
In smaller installations, the MQTT broker and gateway run on the same host. In larger environments, they can be separated for better isolation.
Cloud / Datacenter Nodes
| Processing node | Execution environment | Deployed artifacts | Notes / sizing |
|---|---|---|---|
| Observability Node | Managed Grafana stack or Kubernetes cluster | Prometheus, Tempo, OTLP Collector, Grafana | Collects metrics, traces, and dashboards; configured based on SLOs. |
| Analytics API Node | Kubernetes deployment or VM pool | analytics-api container with ingest endpoint | Receives telemetry via TLS; idempotent ingest prevents duplicates during replay. |
| Object Storage Service | Managed S3-compatible storage | Buckets: telemetry-offload, telemetry-archive | Long-term storage/compliance; cost-driven. |
The model below maps the functional elements to their concrete runtime locations:
- MQTT Client, Ingest Router, HTTP Server, WAL Queue, Dispatcher, Fanout, Admin API, Config & Secrets, Telemetry → run inside the Rust Gateway container.
- The Control Plane interacts with the MQTT broker and STM32 devices.
- Observability export (traces, metrics, logs) goes to the cloud Observability Node.
- Sinks (Kafka/S3/MQTT) forward downstream to the Analytics API or Object Storage.

Network Nodes & Communication Links
In addition to the runtime platform, the Deployment Viewpoint also describes the network layer: how components communicate across the edge–cloud boundary. The diagram shows secure telemetry flows from STM32 → MQTT broker → Rust Gateway → cloud, including protocols, ports, and trust boundaries.
From Prototype to Consulting Product
Over the past months, this gateway has evolved from a technical prototype into the foundation of my consulting work at Combotto.io— where I help teams design secure, reliable, and observable IoT infrastructures.
By turning the prototype into a reusable reference architecture, I now use it as a blueprint in audits, hardening sprints, and longer-term reliability partnerships with clients who need secure edge-to-cloud data flows.
If you are building something similar and want external sparring, I offer:
- Audit: Review of existing IoT data flows and reliability setup.
- Hardening Sprint: A short, focused engagement to improve security and observability.
- Reliability Partnership: Ongoing collaboration to scale your system safely.
Conclusion
Building IoT systems that are both stable and secure requires more than code — it requires the right architectural perspectives from day one.
This Rust-based IoT gateway serves as my reference architecture for connecting embedded devices to cloud infrastructure in a secure and reliable way. I continue to evolve it as part of my work at Combotto.io.
If you work with connected devices and want to strengthen data reliability, harden telemetry paths, or scale with confidence, feel free to reach out — I’m happy to share insights or help your team.
- Rozanski, Nick and Woods, Eoin. Software Systems Architecture: Working with Stakeholders Using Viewpoints and Perspectives (2nd Edition). Addison-Wesley, 2012.